Introduction
Debugging is an essential skill for any Python developer. Whether you’re a beginner or an expert, encountering bugs is inevitable. Knowing how to efficiently debug your code can save you time and frustration. Two of the most powerful debugging tools in Python are pdb (Python Debugger) and PyCharm’s built-in debugger.
In this guide, we’ll explore how to debug Python like a pro using pdb and PyCharm’s debugger. You’ll learn step-by-step how to set breakpoints, inspect variables, and fix errors efficiently.(Python Debugging Like a Pro)
🔗Related Posts:
- 7 Fixes for Why Is My Python Code Not Running?
- Python Crash Fix: 7 Solutions for Jupyter & Spyder Issues
- 10 Proven Ways to Debugging Python in PyCharm and VS Code
- How to Install Python: Easy Setup Guide for Beginners
- Python UnicodeDecodeError Fix – Easy Encoding Solutions
- 7 Python Debugging Pitfalls to Avoid in VS Code and PyCharm
Table of Contents
- What is Debugging?
- Why Use
pdband PyCharm’s Debugger? - Getting Started with
pdb - Common
pdbCommands and Their Uses - PyCharm’s Debugger: A Powerful Alternative
- Step-by-Step Guide to Debugging in PyCharm
- Best Practices for Efficient Debugging
- Conclusion
- Frequently Asked Questions (FAQs) for Python Debugging Like a Pro
What is Debugging?
Debugging is the process of identifying, analyzing, and fixing errors in a program. Bugs can cause incorrect outputs, crashes, or performance issues. Debugging tools help developers track down these issues efficiently.
Why Use pdb and PyCharm’s Debugger?
Python offers several debugging tools, but pdb and PyCharm’s debugger stand out due to their efficiency and ease of use.
✅ pdb (Python Debugger)
- A built-in debugging tool available in all Python installations.
- Works directly in the terminal without requiring an external tool.
- Lightweight and easy to use.
✅ PyCharm’s Debugger
- A feature-rich, visual debugger integrated into PyCharm.
- Provides a GUI with breakpoints, step execution, and variable inspection.
- Saves time by making debugging intuitive and user-friendly.
Both tools are essential for any developer looking to debug Python code effectively.
Getting Started with pdb
pdb is Python’s built-in debugging module. You don’t need to install anything extra—just import and use it.
Basic Usage
To start using pdb, insert the following line in your script where you want to pause execution:

When the code reaches this line, execution will pause, allowing you to inspect variables and step through the code.
Example
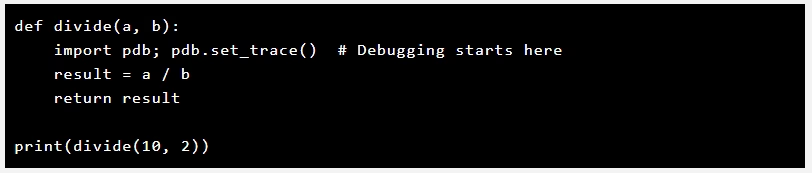
Run the script, and when it reaches pdb.set_trace(), the debugger will activate.
Common pdb Commands and Their Uses
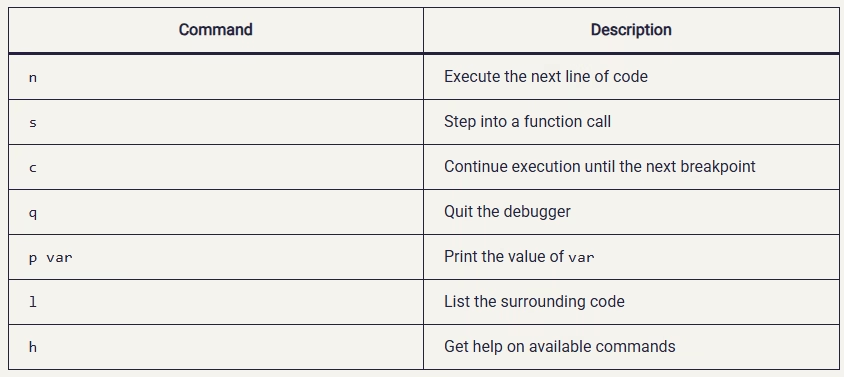
Using these commands, you can effectively navigate through your code and identify errors.
PyCharm’s Debugger: A Powerful Alternative
PyCharm, one of the most popular Python IDEs, includes a built-in debugger that offers a more user-friendly debugging experience.
Why Use PyCharm’s Debugger?
- No need to insert
pdb.set_trace()manually. - Graphical interface for setting breakpoints.
- Step-by-step execution for better debugging insights.
- Variable inspection, watches, and expression evaluation.
Step-by-Step Guide to Debugging in PyCharm
Step 1: Set a Breakpoint
- Open your Python script in PyCharm.
- Click on the left margin next to the line number where you want execution to pause. A red dot will appear, indicating a breakpoint.
Step 2: Start Debugging
- Click Run > Debug or press
Shift + F9to start debugging.
Step 3: Control Execution
Use the following controls in PyCharm’s debugger:
✅ Step Over (F8): Executes the next line without stepping into functions.
✅ Step Into (F7): Moves inside function calls for deeper debugging.
✅ Resume Program (F9): Continues execution until the next breakpoint.
Step 4: Inspect Variables
- Use the Variables panel to check variable values.
- Modify values during runtime to test different scenarios.
Step 5: Use Watches & Evaluate Expressions
- Add variables to Watches to track changes in their values.
- Use the Evaluate Expression tool (
Alt + F8) to test expressions dynamically.
Best Practices for Efficient Debugging
1. Use Breakpoints Wisely
- Don’t add too many breakpoints. Focus on critical areas where the bug is likely occurring.
2. Print Statements vs. Debugger
- While
print()can help, a debugger provides a more powerful way to inspect variables and flow.
3. Debug in Small Increments
- Run your code in smaller sections to isolate issues quickly.
4. Read Error Messages Carefully
- Python’s traceback messages provide valuable insights into what went wrong.
5. Use Logging for Advanced Debugging
- If debugging in production, consider using Python’s
loggingmodule for tracking issues.
For more details, check out Python’s official pdb documentation and PyCharm Debugging Guide.
Conclusion
Debugging is a vital skill for any Python developer. Whether you prefer pdb for its simplicity or PyCharm’s debugger for its GUI-based ease of use, mastering these tools will make your debugging process faster and more efficient.
By following the best practices outlined in this guide, you can Python Debugging Like a Pro and ensure your code runs smoothly with minimal errors.
📌 Frequently Asked Questions (FAQs) for Python Debugging Like a Pro
1. What is the best way to debug Python code?
pdb (Python Debugger) is a lightweight, built-in method, while PyCharm’s Debugger offers a graphical interface with advanced features like breakpoints, variable inspection, and step execution.2. How do I start debugging with pdb?
pdb by adding this line in your code:import pdb; pdb.set_trace()
When you run the script, execution will pause at that line, allowing you to inspect variables and control execution using commands like
n (next), s (step into), and c (continue).3. What are the benefits of using PyCharm’s Debugger?
✅ A user-friendly graphical interface.
✅ Easy breakpoints and step-by-step execution.
✅ Real-time variable inspection.
✅ Faster debugging compared to manual
pdb usage.4. Can I debug without using an external tool?
pdb and PyCharm’s debugger provide more efficient debugging capabilities, reducing the need for excessive print statements.5. How do I set breakpoints in PyCharm?
-Click on the left margin next to the line number in your code.
-A red dot will appear, marking the breakpoint.
-Run the script in Debug Mode (Shift + F9) to pause execution at the breakpoint.
7. Is debugging in PyCharm free?
8. Can I debug Python scripts in VS Code?
9. What’s the difference between debugging and testing?
–Testing: Running tests (e.g., unit tests) to check if the code behaves correctly. Debugging is used after finding a bug, while testing helps prevent bugs from occurring.
10. How can I improve my debugging skills?
🔹 Use breakpoints to pause execution at critical points.
🔹 Use
pdb or PyCharm’s debugger instead of excessive print() statements.🔹 Read Python’s error messages carefully—they often pinpoint the issue.
🔹 Debug in small sections instead of running the entire script at once.
🔹 Use logging for better tracking of runtime issues.
Do you have a favorite debugging technique? Share it in the comments below!