Debugging Python code can be frustrating, especially for beginners or when working on complex projects. However, with the right techniques and tools, such as VS Code and PyCharm, you can streamline the debugging process and fix issues efficiently. This guide will walk you through common Python debugging pitfalls and provide actionable strategies for debugging in VS Code and PyCharm.
Mastering these debugging techniques will help you troubleshoot errors efficiently, boost productivity, and improve the overall quality of your code. Let’s dive into the most common debugging mistakes and how to avoid them!
📌Related Posts:
- 7 Fixes for Why Is My Python Code Not Running?
- Python Crash Fix: 7 Solutions for Jupyter & Spyder Issues
- 10 Proven Ways to Debugging Python in PyCharm and VS Code
- How to Install Python: Easy Setup Guide for Beginners
- How to Fix Python Installation and Compatibility Issues in Conda and Pip
Table of Contents
- Common Python Debugging Pitfalls and How to Avoid Them
- How to Debug Python in VS Code
- How to Debug Python in PyCharm
- Best Debugging Strategies for Both IDEs
- FAQs About Python Debugging
- Conclusion: Start Debugging Like a Pro
Common Python Debugging Pitfalls and How to Avoid Them
1. Indentation Issues: A Silent Trouble
One of the most frequent Python debugging pitfalls is indentation errors. Since Python uses indentation to define code blocks, a single misalignment can break your program. The most common mistakes include:
- Mixing tabs and spaces
- Accidentally skipping an indentation level
- Using inconsistent spacing throughout the file
How to Fix It:
- Stick to spaces (4 spaces per indentation level) rather than tabs.
- Use an IDE like VS Code or PyCharm, which highlights indentation inconsistencies.
- Enable linting tools such as Pylint to detect and correct indentation issues automatically.
2. Unintentional Global Variables
Accidental use of global variables can lead to unpredictable results, especially when modified in multiple functions.
How to Avoid It:
- Keep variables local to functions whenever possible.
- Use function arguments and return values to pass data between different parts of your program.
- Consider using the
globalkeyword only when necessary.
3. Off-by-One Errors in Loops
Loop errors are common in Python debugging, particularly when iterating over lists, and can cause unexpected behaviors.
How to Fix It:
- Always double-check your start and stop conditions.
- Remember that Python uses 0-based indexing.
- Use
len()function to ensure correct loop ranges.
4. Mutable vs. Immutable Types
Understanding the difference between mutable (e.g., lists, dictionaries) and immutable (e.g., strings, tuples) types is crucial in Python debugging.
How to Avoid Pitfalls:
- Create copies of mutable objects if needed using
.copy()or thecopymodule. - Be cautious when using mutable objects as default function arguments.
5. Improper Handling of None Values
Attempting operations on None values can lead to TypeError crashes in Python debugging.
Best Practices:
- Always check for
Nonebefore performing operations. - Use conditional statements or
assertstatements to verify variables before use.
How to Debug Python in VS Code
1. Setting Up Python Debugging in VS Code
VS Code is a lightweight yet powerful editor with robust Python debugging features.
Steps to Enable Debugging:
- Install the Python extension in VS Code.
- Open the Python script you wish to debug.
- Press
F5or navigate toRun > Start Debugging.
2. Using Breakpoints for Efficient Debugging
Breakpoints allow you to pause execution and inspect variables during Python debugging.
How to Set Breakpoints:
- Click beside a line number to set a breakpoint.
- Use the Debug Console to step through code and analyze variable states.
3. The Debug Console: Inspect and Interact
The Debug Console lets you execute Python commands and evaluate expressions in real-time.
Best Use Cases:
- Printing variables during execution.
- Running individual expressions to test code behavior.
How to Debug Python in PyCharm
1. Setting Up Debugging in PyCharm
PyCharm provides an intuitive debugging interface with advanced Python debugging features.
Steps to Enable Debugging:
- Open your Python script in PyCharm.
- Click the bug icon or press
Shift + F9to start debugging.
2. Real-Time Variable Inspection
PyCharm’s Variables pane allows real-time tracking of variable states for Python debugging.
Benefits:
- Modify variable values mid-execution to test different scenarios.
- Monitor data structures for unexpected changes.
3. Conditional Breakpoints for Advanced Debugging
Conditional breakpoints enable targeted debugging by pausing execution only when a specified condition is met.
How to Use Conditional Breakpoints:
- Right-click a breakpoint in PyCharm.
- Select
Set Conditionand enter the desired condition.
Best Debugging Strategies for Both IDEs
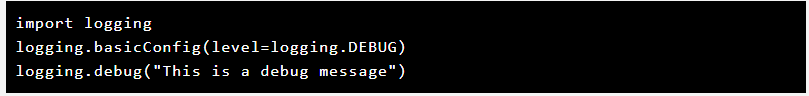
1. Use Logging for Better Insights
Rather than printing variables manually, use Python’s built-in logging module to track execution flow.
Example:
2. Read and Understand Tracebacks
Python debugging tracebacks provide crucial information about errors, including their type and origin.
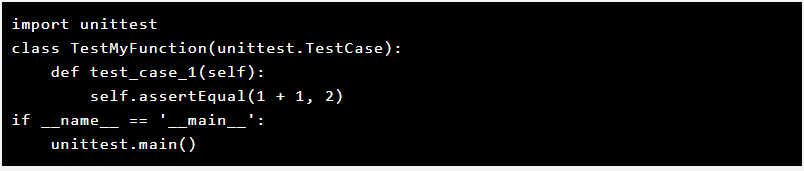
3. Implement Unit Tests
Using unittest or pytest can help catch bugs early.
Example Using unittest:
4. Leverage External Debugging Tools
FAQs About Python Debugging
1. How do I start debugging in VS Code?
F5 to start debugging. You can also open the Debug Console to interact with the running code and inspect variables.2. How can I avoid indentation errors in Python?
F5 to start debugging. You can also open the Debug Console to interact with the running code and inspect variables.3. What is the role of mutable and immutable types in debugging?
4. How do I debug Python code in PyCharm?
Shift + F9. Use the Variables pane and Conditional Breakpoints for advanced inspection.5. Can I debug Python without using breakpoints?
6. How can I improve debugging in large Python projects?
Conclusion: Start Debugging Like a Pro
By understanding common Python debugging pitfalls and effectively using VS Code and PyCharm, you can improve your debugging workflow. These strategies will help you save time and enhance your overall development process.
Next Steps:
- Apply these Python debugging techniques in your projects.
- Explore advanced debugging tools and plugins.
- Continue learning with Python documentation and tutorials.
For more Python debugging tutorials, visit Python’s official documentation.
Happy debugging!